Search our catalog

    We also offer custom consulting and training services for commercial, digital, flexo, web, and grand format printing markets.

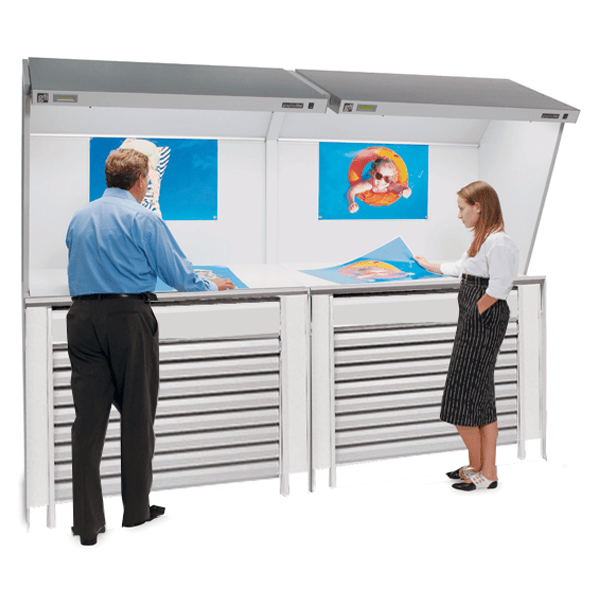
    Lighting

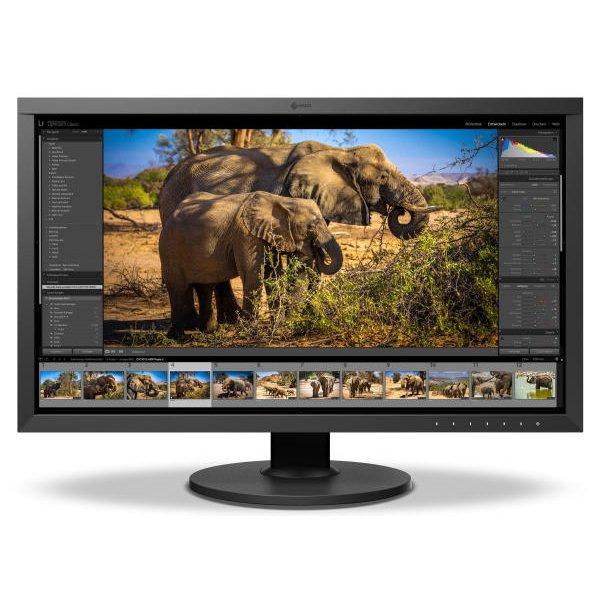
    Monitors

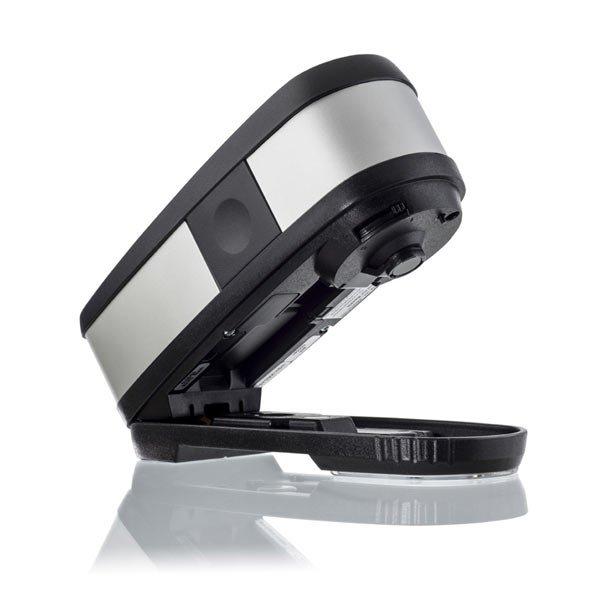
    Spectrophotometers

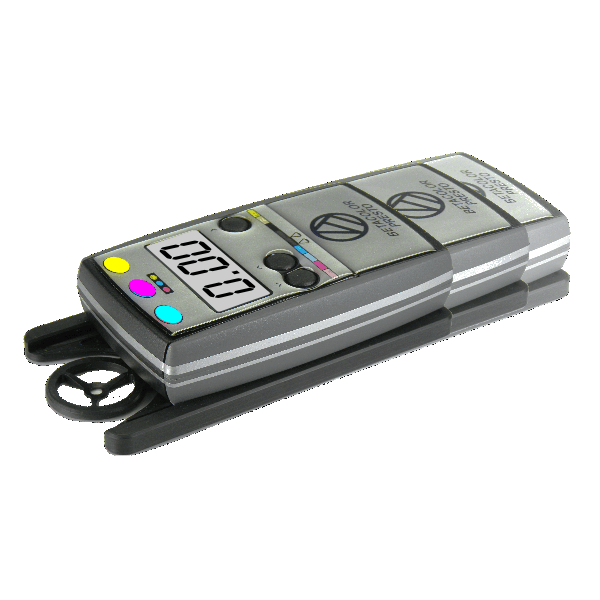
    Densitometers

    Color Communication

    All the hardware you need to ensure the quality of your color

    All the software you need to ensure the quality of your color

    ColorLogic

    CA-2006

    ColorLogic ColorAnt L Upgrades

    Upgrade from

    • ColorLogic ColorAnt 10

      colorant tools

      ColorAnt is an easy-to-use tool that corrects an optimizes measurement data. The features include the ability to edit primary colors, substrate color and recalculate measurement data with the use of full sized test charts.

      ColorAnt's main panel interface allows quick access to all tools from one easyto-use location. Icons display the purpose of each function on the panel.


      What's New in ColorAnt 10?

      • New Testchart Options - Create custom spot color libraries
      • New Option for White Point Correction - Direct measurement of the white point in the tools White Correction and Edit Primaries
      • New G7® Evaluation Method - Check measurement data for G7® conformity
      • Improved Measurement Data Report - More G7® and OBA information in the Report
      • Improved Spot Color Report- More information on spot color reproduction
      • Improved View Tool - New RGB filter, search function and Info tab
      • Automation via CLI - ColorAnt workflow integration via command line
      • Easy access to favorite files - Access frequently used files via the context menu

      Highlights of ColorAnt


      Video


      ColorLogic ColorAnt Features

      Features ColorAnt M ColorAnt L ColorAnt XL
      Support for data up to 4C
      Data Import/Export Custom Chart Generation
      Editing
      Merging and Conversion
      Viewing, Comparing, Save History Log
      ICC Transformation, View and Compare, also works with multicolor data
      Support for Multicolor data up to 15C*
      Proof Evaluation Tool
      Embed CxF/X-4
      Command Line Interface (CLI)


      Proof Evaluation Tool

      proof evaluation tool

      Proof Evaluation Toolcan be used to check whether the proof measurement data from a media wedge fulfills the requirements for a contract proof according to ISO 12647-7 or a validation print according to ISO 12647-8.


      Command Line Interface (CLI)

      Command Line Interface (CLI) - ColorAnt can now be controlled via the command line. It is intended for developers, scripters and experts and describes the usage of the command line interface of ColorAnt.

      Note: The new CLI functionality is part of the new ColorAnt XL package.

      Back To The Top ⇑


      Data Import/Export

      The group Data Import/Export - contains tools that beside loading existing measurement data files via the file menu allow to create measurement files.


      custom chart

      Custom Chart - designed for creating the reference files for test chart generation. Custom Chart allows you to generate reference files for color spaces such as Gray, RGB, and CMYK. Creating multicolor charts requires a ColorAnt L license. Charts can have up to 15 channels.


      export chart

      Export Chart - allows to create test charts based on device color values, which can be stored as TIFF or PSD files to be printed on a printer.


      measure software

      Measure Software - measure any test charts or media wedges via the UPPCT software tool and transmit the measurement data directly to ColorAnt. There are multiple measurement instruments supported.


      report tool

      Report Tool - generates a comprehensive analysis of your measurement data in form of a PDF or XML file. It also provides the user with corrective recommendations for such measurement


      embed cxf/x-4

      Embed CxF/X-4 - allows CxF/X-4 spectral information to be embedded in PDF documents


      save history log

      Save History Log - records every editing step, and saves all activities that have been applied to all files as a comprehensive PDF document


      Back To The Top ⇑


      Editing

      The actual tools to edit your measurement files are located in the Editing group.


      redundancies

      Redundancies - Corrects color patches by averaging the redundant patches and replacing with the same value.


      correction

      Correction - detects faulty measurements or inconsistent measured values and replaces the data with expected measurement values.


      smoothing

      Smoothing - Corrects inhomogeneous measurement data and non-smooth curves by interpolating existing smoothed data.


      white correction

      White/Black Correction Apply manual corrections to whitest color patch, typically the paper or other substrate. Black correction method can be used to change the darkest black, thereby scaling the entire dataset to the modified black point.


      brightener

      The Brightener tool- adjusts the effect of optical brightening agents (OBA) on measurement data used in papers.


      tone value

      The Tone Value tool - allows very targeted changes to the tone value increase (TVI) curves. The latest version introduces a fourth correction option, ISO 20654 (Multicolor), which only adjusts the multicolor channels to ISO 20654 and leaves the CMYK channels untouched. In addition, a Protect Lights slider has been added which helps users to leave the highlights untouched when applying G7 or ISO 20654 corrections.


      report tool
      colorant rescale

      The Rescale tool - is an optional tool for re-sorting, making random test charts readable or also for rescaling to completely different test chart layouts.


      edit primaries

      Edit Primaries - is a very comprehensive tool to edit, exchange, add or remove primaries and the paper white point in your measurement data.

      • new Adopt Secondaries feature allows user to take advantage of color overprints with other primaries, such as secondary color data


      color editor

      Color Editor - edit color patches and process color conversions of spot colors

      • edit patch names, lab values (CIE), or device color values (DCS)
      • convert and optimize a complete spot color library to a target profile for RGB, CMYK, or Multicolor


      Back To The Top ⇑


      Merging and Conversion

      The tools in the Merging and Conversion group are designed for use on multiple measurement data sets and it contains special tools for conversion.


      averaging

      Averaging - average multiple test chart measurement files having the same layout and amount of patches.


      link

      Link - merge multiple single readings of test charts to one big measurement file.


      icc transformation

      ICC Transformation - is designed to apply printer and/or DeviceLink profiles to reference data in order to conduct profile tests and comparisons.


      cie conversion

      Changes to the Observer from a standard 2 Degrees to a 10 Degrees observer and changes the Illumination from the standard D50 light source.


      Back To The Top ⇑


    Customer Reviews

    Be the first to write a review
    0%
    (0)
    0%
    (0)
    0%
    (0)
    0%
    (0)
    0%
    (0)
    23
    Verified Reviews